Conventional wisdom would say "No," but a bullish trend in the all important 10 year swap could point to higher rates and lower treasury prices ahead.
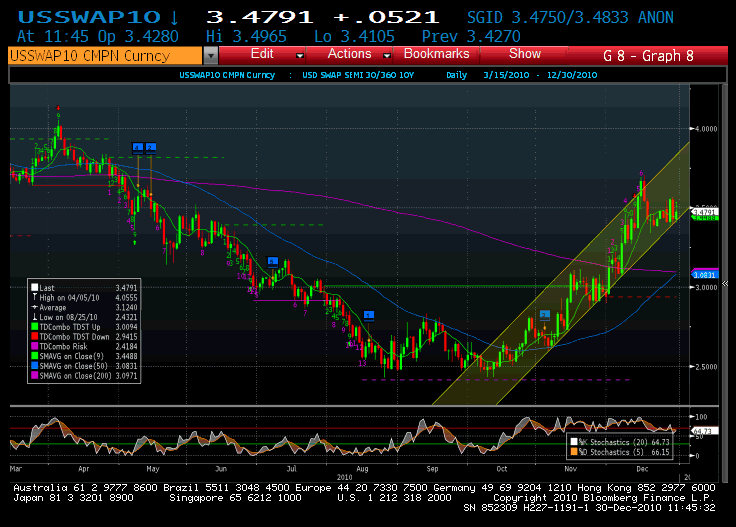
The 10 year swap rate has gained significantly from its October 12, 2010 low of 2.4332% to around 3.485% as of December 30, 2010. Note the "3" marker on Chart 1 at November 3, 2010, indicating the Treasury announcement of the purchase of $600 billion in treasuries.
Swaps are in a bullish channel as shown in Chart 1. Furthermore, for you technical analysts in training, note the impending Golden Cross as the 50 day moving average, currently 3.0830% may cross the 200 day, currently at 3.0971%.
Despite the retreat from the December 15 intraday high of 3.6960% the bottom of the bullish channel remains intact.
Chart 1: Daily 10 Year Swap Rates
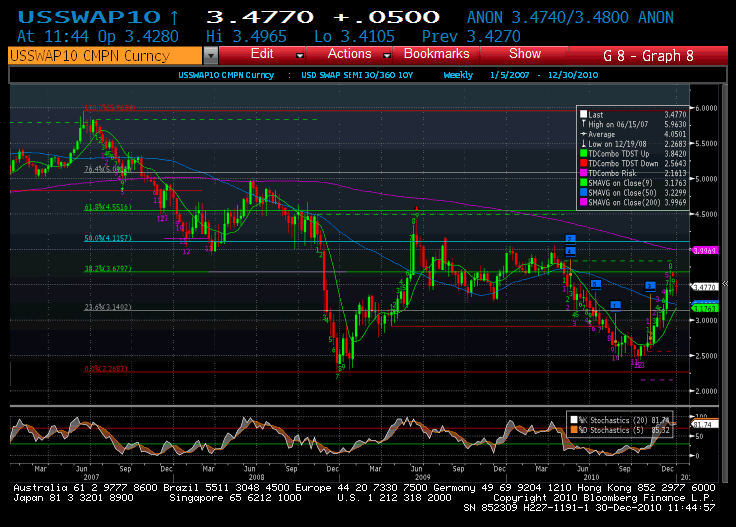
The second chart shows weekly swap rates from the June 2007 highs to the December 2008 lows. The 38.2% Fibonacci retracement of 3.6797% held earlier this month with support at 3.1402%. A pullback to this level may be a good time to lock in borrowing costs.
Chart 2: Weekly 10 Year Swap Rates
Source: Bloomberg
With US debt at unsustainable levels this may signal the end of the bull market in treasuries. Swaps are the easiest and least capital intensive method to position for an increase in interest rates and can be used to hedge against future borrowing costs or speculate.
Bottom line: Early 2011 may be the last chance to lock in historically low borrowing costs.


No comments:
Post a Comment