Pages

Monday, January 24, 2011

Follow Up on the 10 Year Swap

Since reaching a high on December 16 of 3.7105%, swaps have fallen back and traded sideways. 
On the technical side 3.6797% is the 38.2% Fibonacci retracement from the June 2007 highs of 5.9630% to the December 2008 lows of 2.2683%.  This is a key technical level which has held recently and swaps last traded above it in April of 2010.  Currently, longer term support appears to be 3.1402% which is the 23.6% Fibonacci retracement based on the same levels.
On the bullish side, the 50 DMA has crossed the 200 DMA and there is no sign of treasury issuance slowing down as the US continues to forecast large deficits.  On the bearish side, any problems in the market such as continuing erosion of confidence in the Euro Zone may cause investors to buy treasuries.
Bottom line:  There is uncertainty as to where rates are headed as the sideways trading indicates.  The language of the FOMC rate decision tomorrow may give some clarity.

Wednesday, January 5, 2011

Some Thoughts on ETFs

We have all heard complaints about levered ETFs not realizing the projected returns relative to their underlying indices over longer time periods
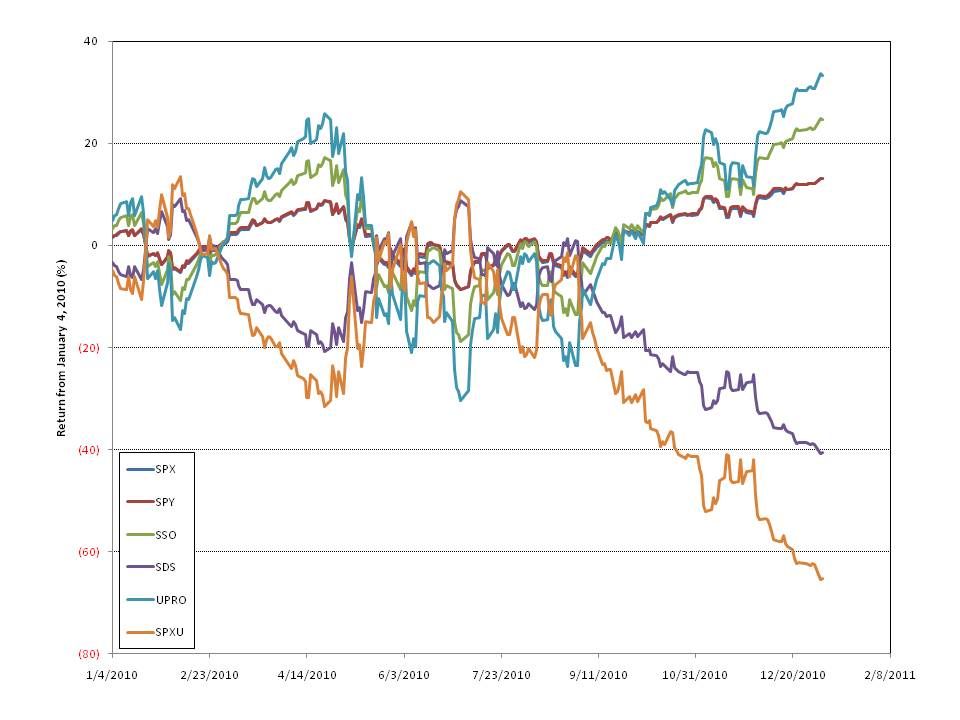
The chart below shows the return of the S&P 500, SPY, SSO, SDS, UPRO, and SPXU from December 31, 2009 through January 4, 2011. 
Notice that in the current bull trend the return on the inverse ETFs has dramatically underperformed.  While SDS should return -2x and SPXU should return -3x at the beginning of 2011 they were off 40% and 65% to the S&P's 13% return.  Clearly, they are losing value significantly faster than -2x and -3x advertised.  The bull funds however, SSO and UPRO, returned 25% and 33% over the same period which closely approximates their +2x and +3x targets.
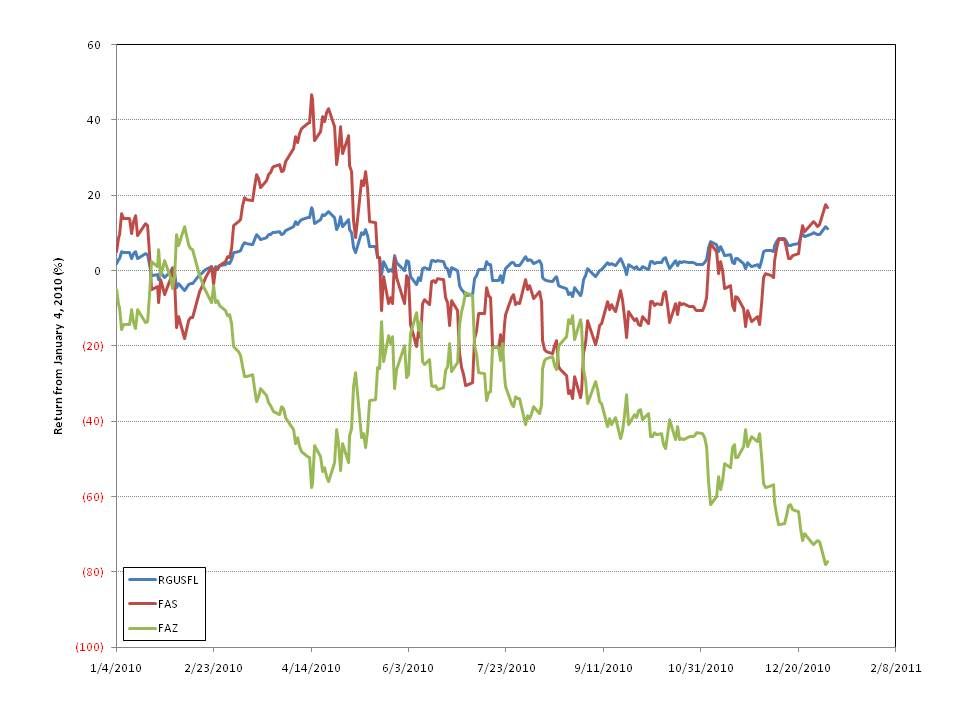
The next chart shows the same period and return calculation for RGUSFL, FAS, and FAZ.  Last year RGUSFL, the underlying index, has returned 11% compared to 17% for FAS, the +3x ETF, and -77% for FAZ, the -3x ETF.
Is this trend tradeable?  The short answer is yes, but first we need to examine another characteristic: Shares Outstanding. 
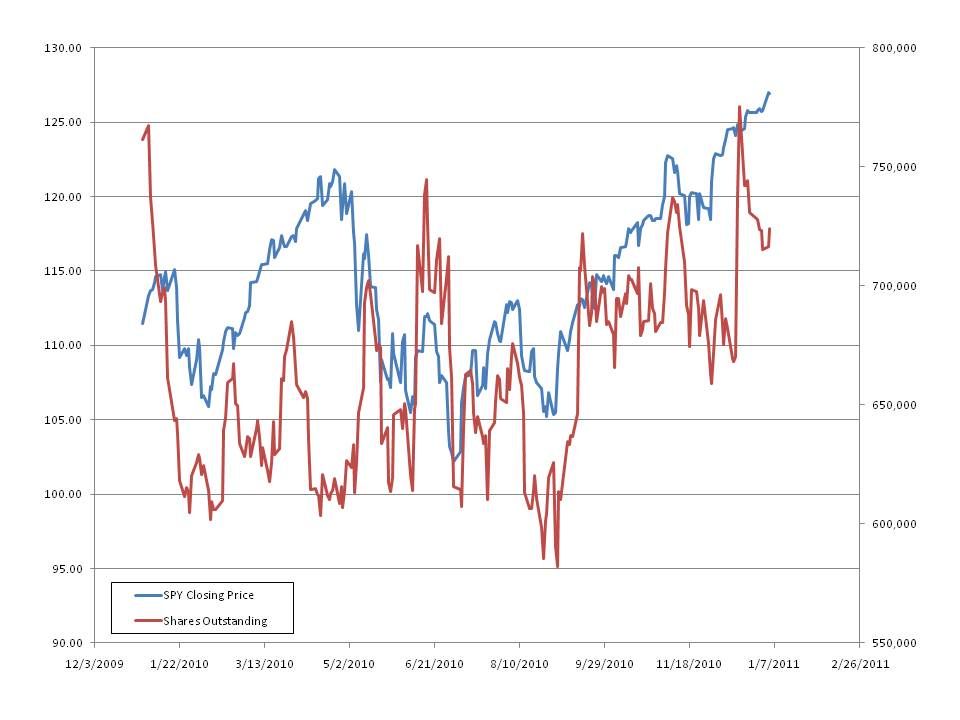
Below are two more charts.  The chart below shows SPY price and Shares Outstanding.  Note that as SPY increases in value the shares outstanding tend to increase (the correlation over the last year is 46%).
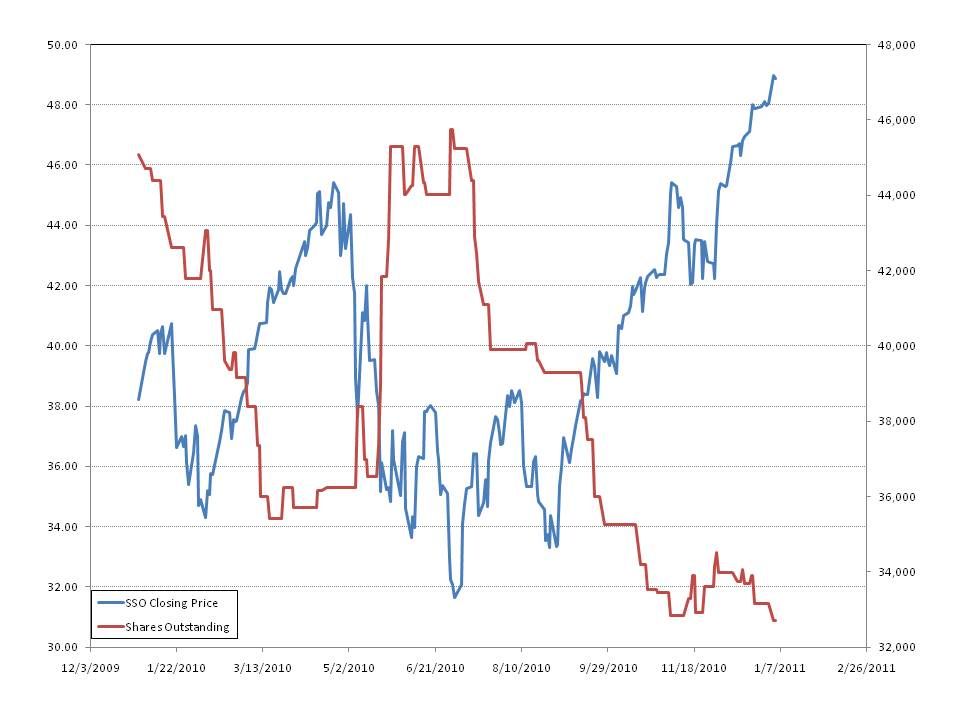
SSO, however, shows an inverse relation between Price and Shares Outstanding with a  -80% correlation and an R squared of 64%.
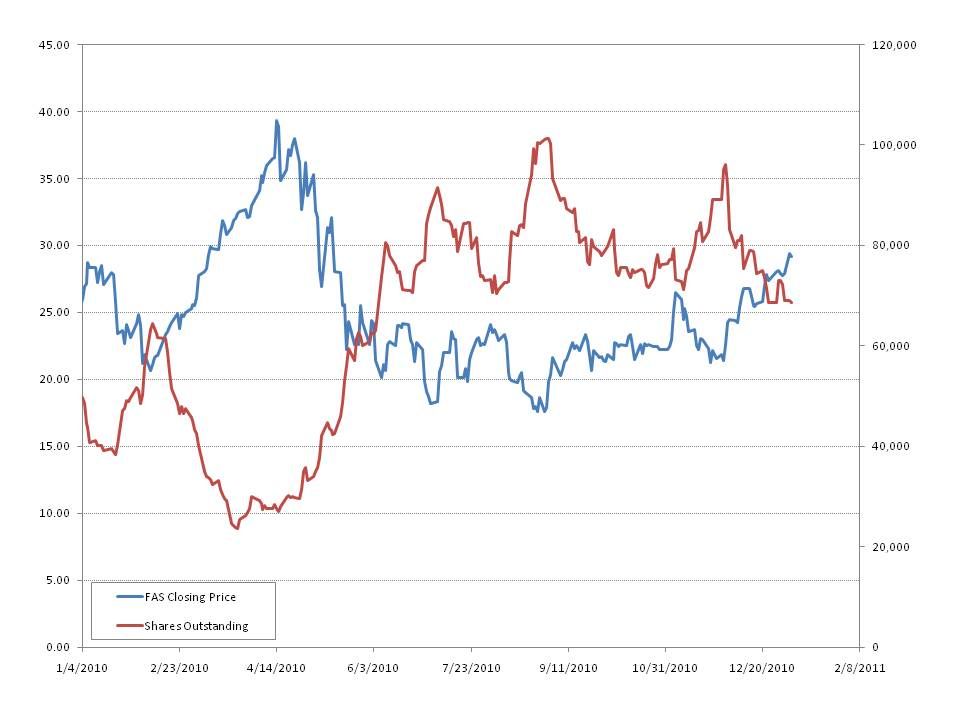
FAS exhibits an even stronger inverse trend between Price and Shares Outstanding with a -84% correlation and an R squared of 70%
What does Shares Outstanding relationship tell us?  As the price of a levered ETF declines shares outstanding has a tendency to increase.  This reflects creation/redemption activity by the market makers.  In other words, as the price goes down traders are creating shares to cover their short positions.
To summarize:  Levered ETFs tend to underperform their benchmarks on a longer time frame as measured by returns, especially the fund that reflects the opposite of the overall index direction.  As the price declines shares outstanding increases. 
The trade that makes sense is to short both the bull and bear levered fund.  Keep the position balanced as a portion of shares outstanding, i.e. short on the way up and cover on the way down.

Monday, January 3, 2011

Some Interesting Thoughts to Start 2011

I ran across two interesting blog posts that are worth looking at.  First, Trending ETF Pairs on Valueevents.com Trending ETF Pairs on Valueevents.com.
ETFs offer many pair trading strategies although I prefer to use the leveraged funds where possible as the time decay is heightened with leverage. 
Second, although I am not a technician, I liked the post Top 10 Technical Events in 2010 on Stockcharts.com.
The last chart on long term treasure rates follows nicely from my discussion of swaps pricing from December 30.

Friday, December 31, 2010

Is CMBS the Best Way to Gain Real Estate Exposure?

CMBS took a real beating during the great recession but with the weaker borrowers already gone and with prices for securities in a significant rally it may be time to look here for real estate exposure.

Compared to RMBS, CMBS offers some advantages. First, the CMBS universe is not plagued by robo-signers, documentation issues, and the emotions common with residential lending. Second, the equity tranches are deeper and have already sustained losses with yield still paying out to senior tranches. Third, duration is known as most securitized loans require defeasance or a yield maintenance premium on prepayments. Finally, bargain hunters are out and active in the commercial real estate space. With many REITs trading strong they have cash for acquisitions and support of existing properties.

A recent article on Bloomberg indicates Moody's commercial property index is climbing:  U.S. Commercial Property Rises For Second Consecutive Month, Moody's Says.  Also, check out this article from the New York Times on CMBS: The Upside? Things Could Be Worse.

Another way to consider additional exposure or hedging current positions is the Markit CMBX index. Check the indices out here:  Markit CMBX Indices.  As with any other CDS index they provide liquidity and lower initial capital investment. Just remember the lessons from AIG before getting too short!

It may seem strange to discuss increasing borrowing costs yesterday and investing in fixed income today, however in an upturn of commercial real estate prices it may provide relative security at a better yield. Further, by combining a CMBS purchase with an interest rate swap investors can hedge against falling bond prices. With liquid markets available to hedge interest, credit, and real estate exposure tailoring risk to individual preferences can be achieved.

Thursday, December 30, 2010

Can You Fight the Fed?

Conventional wisdom would say "No," but a bullish trend in the all important 10 year swap could point to higher rates and lower treasury prices ahead.
The 10 year swap rate has gained significantly from its October 12, 2010 low of 2.4332% to around 3.485% as of December 30, 2010.  Note the "3" marker on Chart 1 at November 3, 2010, indicating the Treasury announcement of the purchase of $600 billion in treasuries. 
Swaps are in a bullish channel as shown in Chart 1.  Furthermore, for you technical analysts in training, note the impending Golden Cross as the 50 day moving average, currently 3.0830% may cross the 200 day, currently at 3.0971%. 
Despite the retreat from the December 15 intraday high of 3.6960% the bottom of the bullish channel remains intact.
Chart 1:  Daily 10 Year Swap Rates
Source:  Bloomberg

The second chart shows weekly swap rates from the June 2007 highs to the December 2008 lows.  The 38.2% Fibonacci retracement of 3.6797% held earlier this month with support at 3.1402%.  A pullback to this level may be a good time to lock in borrowing costs.
Chart 2:  Weekly 10 Year Swap Rates
Source:  Bloomberg
With US debt at unsustainable levels this may signal the end of the bull market in treasuries.  Swaps are the easiest and least capital intensive method to position for an increase in interest rates and can be used to hedge against future borrowing costs or speculate.
Bottom line:  Early 2011 may be the last chance to lock in historically low borrowing costs.

Wednesday, December 29, 2010

Is the VXX Due for a Bounce?

VXX is an ETN designed to give equity traders easy access to trading volatility.  Underlying the VXX is the first and second month VIX futures as represented in the SPVSTR index(1).
The VXX has lost nearly 75% this year and recently split 1 for 4 to get the price back up.  Currently VIX futures are in sharp contango making it much more expensive to use the futures contracts to hedge volatility.  This is a negative for the VXX as it must roll the underlying holdings every month before expiration.  Contango has given rise to an ETF strategy of shorting the VXX (futures months 1 and 2) and buying the VXZ (futures months 4 - 7).    
There are indicators of a bounce, however.  First, VXX has seen nearly $500 million in inflows over the last two days(2).  The easiest way to track the money flows is by looking at the number of shares outstanding; VXX shares outstanding has increased by more than 12 million in the last few days.  While the VXX is recently off a 52 week low shares outstanding is putting in 52 week highs indicating that market makers are covering short positions.  Meanwhile, VXZ shares outstanding put in a 52 week high on Monday and nearly 5 million shares were redeemed on Tuesday indicating that long positions are selling.  It looks a lot like the short VXX / long VXZ trade is unwinding.
An increase in shares outstanding for VXX is very bullish and coupled with the anecdotal evidence of the VXX/VXZ trade unwinding could be good for a short term bounce.  Is it enough to fight the January effect?  Only time will tell.
Sources:

Tuesday, December 28, 2010

Welcome to The Speculator's Ball

Dear Reader,
Welcome to my blog, The Speculator's Ball.  Whether you arrived here through a recommendation or a search or just a few random clicks feel free to take some time and check our offerings. 
If the title sounds vaguely familiar you have probably come to the right place.  In this space we will discuss speculating and hedging using various financial instruments including ETFs, interest rate swaps and options, and credit default swaps.
Thanks for stopping by!
Disclaimer:  No strategy, security, analysis or chart or any other material posted herein may be considered a recommendation to buy or sell.  All materials posted in this blog are for discussion purposes only and should not be relied upon when making investment or trading decisions.  The Blogger takes no responsibility for any errors or omissions and readers use the material at their own risk.