We have all heard complaints about levered ETFs not realizing the projected returns relative to their underlying indices over longer time periods
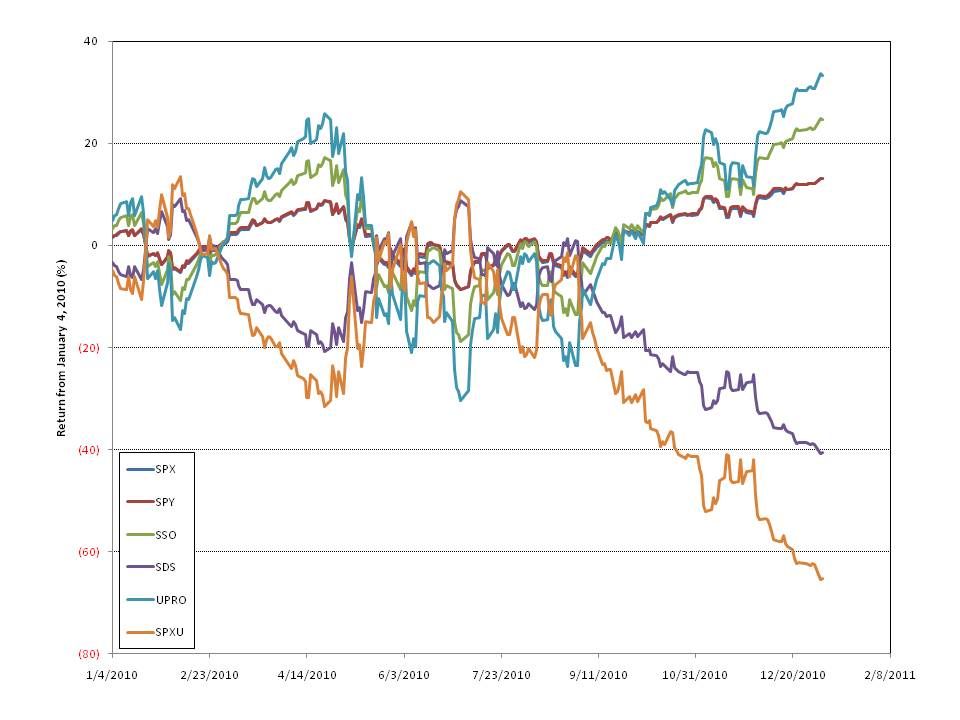
The chart below shows the return of the S&P 500, SPY, SSO, SDS, UPRO, and SPXU from December 31, 2009 through January 4, 2011.
Notice that in the current bull trend the return on the inverse ETFs has dramatically underperformed. While SDS should return -2x and SPXU should return -3x at the beginning of 2011 they were off 40% and 65% to the S&P's 13% return. Clearly, they are losing value significantly faster than -2x and -3x advertised. The bull funds however, SSO and UPRO, returned 25% and 33% over the same period which closely approximates their +2x and +3x targets.
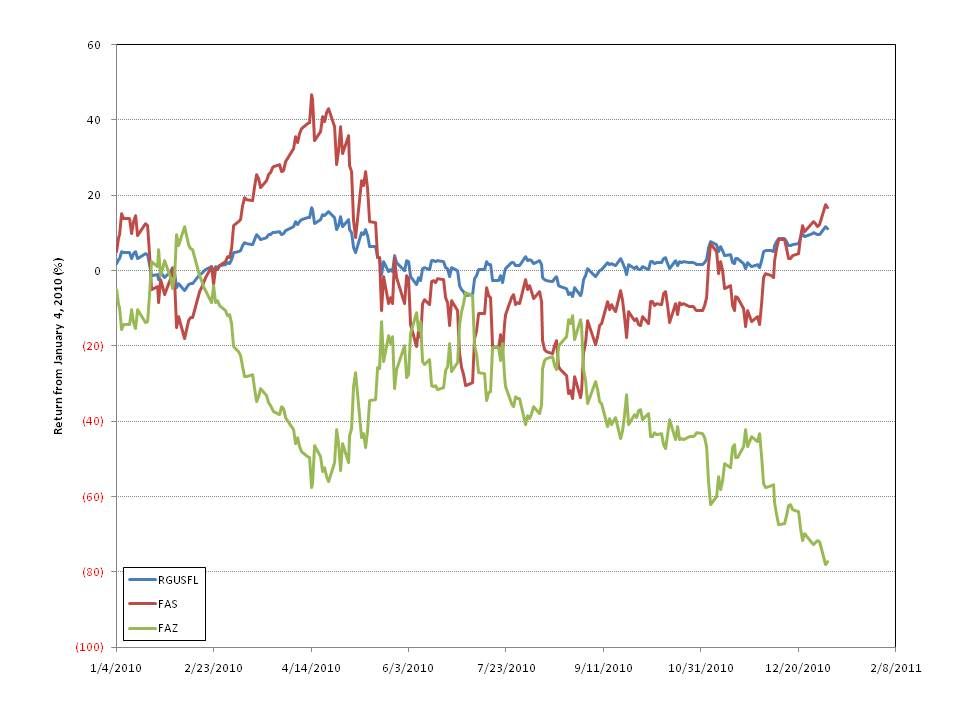
The next chart shows the same period and return calculation for RGUSFL, FAS, and FAZ. Last year RGUSFL, the underlying index, has returned 11% compared to 17% for FAS, the +3x ETF, and -77% for FAZ, the -3x ETF.
Is this trend tradeable? The short answer is yes, but first we need to examine another characteristic: Shares Outstanding.
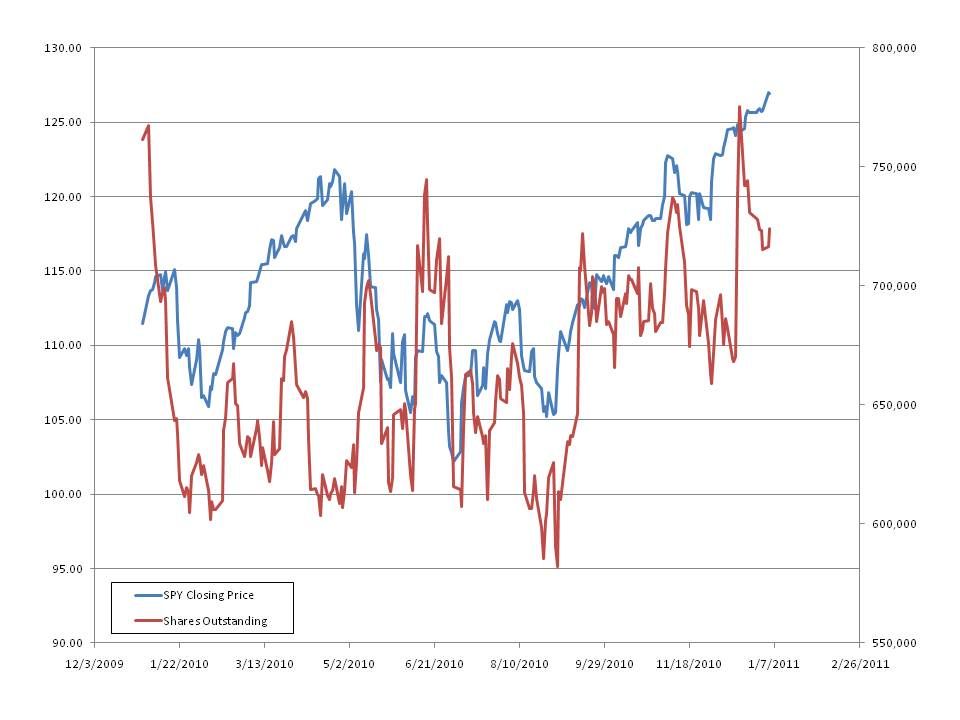
Below are two more charts. The chart below shows SPY price and Shares Outstanding. Note that as SPY increases in value the shares outstanding tend to increase (the correlation over the last year is 46%).
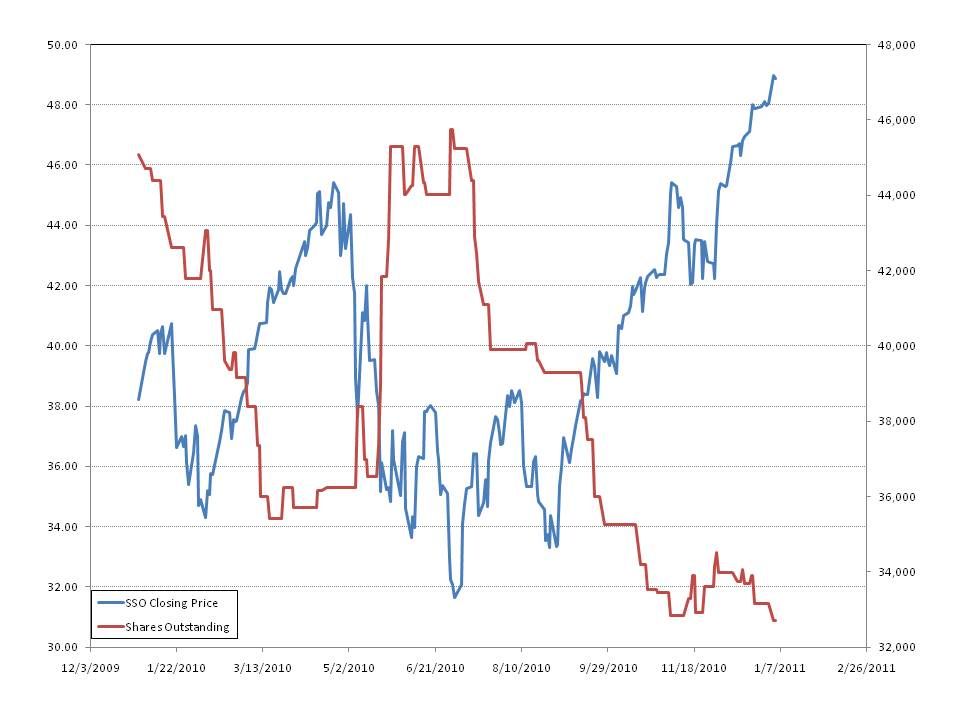
SSO, however, shows an inverse relation between Price and Shares Outstanding with a -80% correlation and an R squared of 64%.
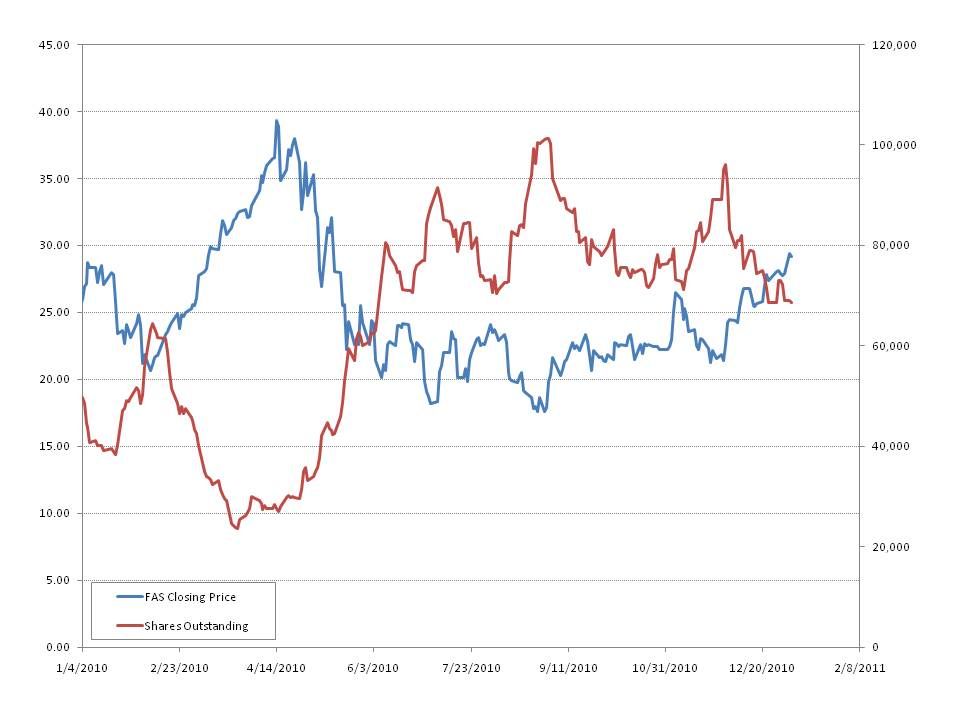
FAS exhibits an even stronger inverse trend between Price and Shares Outstanding with a -84% correlation and an R squared of 70%
What does Shares Outstanding relationship tell us? As the price of a levered ETF declines shares outstanding has a tendency to increase. This reflects creation/redemption activity by the market makers. In other words, as the price goes down traders are creating shares to cover their short positions.
To summarize: Levered ETFs tend to underperform their benchmarks on a longer time frame as measured by returns, especially the fund that reflects the opposite of the overall index direction. As the price declines shares outstanding increases.
The trade that makes sense is to short both the bull and bear levered fund. Keep the position balanced as a portion of shares outstanding, i.e. short on the way up and cover on the way down.
